Planejamento Tático e Workshop
Atitudes no Workshop: Reforço + e -, ruptura e punição.
quinta-feira, 26 de setembro de 2019
Exercícios (atualizado 26/9/2019)
Exercícios (atualizado 26/9/2019)
Exercícios
Exercícios
– Exercício Numero ...
– Autor
E-Mail da Disciplina:
gestao.estat.cert@gmail.com
Exercício 1 Prático - Criar um exemplo de regressão e resolva. D.L.: 15/8/2019. (Seguir videoaulas)
Exercício 1 Teórico - sistemas Mundiais de Gestão, 3 slides. D.L.: 15/8/2019.
Exercício 2 Teórico - Elabore um texto comparando a estrutura de um documento cientifico e um relatório técnico (corporativo)
Exercício 2 Prático - Criar um exemplo de Teste T e resolva utilizando macros em Excel. D.L.: 5/9/2019. (Seguir videoaulas)
Exercício 3 Prático - Criar um exemplo de ANOVA e resolva no SAS. D.L.: 5/9/2019. (Seguir videoaulas)
Exercício 4 Prático - Criar um exemplo de Aprendizagem de Maquina (data mining) e Data Crunching e resolva utilizando Pivot Tables em Excel e SAS. D.L.: 12/9/2019. (Seguir videoaulas)
Exercício 3 Teórico - Elabore uma apresentação, seis slides, sobre data crunching, data mining e data analysis.
. D.L.: 12/9/2019.
Exercício 5 Prático - Criar um exemplo de MANOVA SAS. D.L.: 3/10/2019.
Exercício 4 Teórico - Elabore uma apresentação, 3 slides, sobre TQM (Toyota - GE - Porsche).
D.L.: 12/9/2019.
ISO 9001
BSC
PNQ
Lean Sta.
Lean Canvas
Aula 26/9/2019 - Apresentação do Blog do Laboratório
Aula 26/9/2019
- Apresentação do Blog do Laboratório:
https://lcd-gs4-usp.blogspot.com
Estão todos convidados
- Checarmos Exercícios e Agenda Seminários
- Seminários
- Aula Machine Learning - Discriminante
- Apresentação do Blog do Laboratório:
https://lcd-gs4-usp.blogspot.com
Estão todos convidados
- Checarmos Exercícios e Agenda Seminários
- Seminários
- Aula Machine Learning - Discriminante
segunda-feira, 23 de setembro de 2019
Programa SAS - IRIS - Machine Learning Supervisionado - An. Discriminante Linear e Quadrático
Programa SAS - IRIS - Machine Learning Supervisionado - An. Discriminante Linear e Quadrático
Programa SAS
Programa SAS
Benchmarking Funcional
Programa para Diagnosticar Falsificação de Dinheiro (Franco Suíço):
Analise Discriminante Linear - Funções Canônicas de Fisher
Seminário Gabriel Sarriés e Colegas em Cirso de Machine Learning - Prof. Rafael (Irlanda) .... e Gabriel Machado (Agosto de 2019)
Analise Discriminante Linear - Funções Canônicas de Fisher
data banco;
input obs Status $ Length Left Right Bottom Top Diagonal;
cards;
1 0 214.8 131.0 131.1 9.0 9.7 141.0
2 0 214.6 129.7 129.7 8.1 9.5 141.7
...
proc discrim data=banco method=normal pool=no
crossvalidate;
class Status;
priors prop;
var Length Left Right Bottom Top Diagonal;
run;
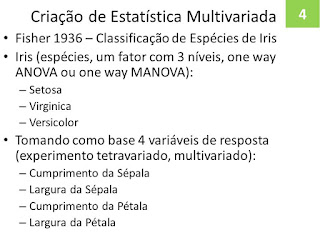
Fazendo o Benchmarking para IRIS:
data iris;
input Cum_Sep Lar_Sep Cum_Pet Lar_Pet Especie $;
cards;
5.1 3.5 1.4 0.2 I_setosa
4.9 3 1.4 0.2 I_setosa
...
proc discrim data=iris method=normal pool=yes
crossvalidate;
class Especie;
priors prop;
var Cum_Sep Lar_Sep Cum_Pet Lar_Pet ;
run;
OK Programa Pronto!!!
Observação: Para fazer An. Discriminante Quadrático trocar pool=yes por pool=no, somente temos que fazer isso.
Agora Vamos colocar os dados junto com o Programa que Desenvolvemos por Benchmarking:
Programa SAS para Analise Discriminante Linear para IRIS-Fisher:
data iris;
input Cum_Sep Lar_Sep Cum_Pet Lar_Pet Especie $;
cards;
5.1 3.5 1.4 0.2 I_setosa
4.9 3 1.4 0.2 I_setosa
4.7 3.2 1.3 0.2 I_setosa
4.6 3.1 1.5 0.2 I_setosa
5 3.6 1.4 0.2 I_setosa
5.4 3.9 1.7 0.4 I_setosa
4.6 3.4 1.4 0.3 I_setosa
5 3.4 1.5 0.2 I_setosa
4.4 2.9 1.4 0.2 I_setosa
4.9 3.1 1.5 0.1 I_setosa
5.4 3.7 1.5 0.2 I_setosa
4.8 3.4 1.6 0.2 I_setosa
4.8 3 1.4 0.1 I_setosa
4.3 3 1.1 0.1 I_setosa
5.8 4 1.2 0.2 I_setosa
5.7 4.4 1.5 0.4 I_setosa
5.4 3.9 1.3 0.4 I_setosa
5.1 3.5 1.4 0.3 I_setosa
5.7 3.8 1.7 0.3 I_setosa
5.1 3.8 1.5 0.3 I_setosa
5.4 3.4 1.7 0.2 I_setosa
5.1 3.7 1.5 0.4 I_setosa
4.6 3.6 1 0.2 I_setosa
5.1 3.3 1.7 0.5 I_setosa
4.8 3.4 1.9 0.2 I_setosa
5 3 1.6 0.2 I_setosa
5 3.4 1.6 0.4 I_setosa
5.2 3.5 1.5 0.2 I_setosa
5.2 3.4 1.4 0.2 I_setosa
4.7 3.2 1.6 0.2 I_setosa
4.8 3.1 1.6 0.2 I_setosa
5.4 3.4 1.5 0.4 I_setosa
5.2 4.1 1.5 0.1 I_setosa
5.5 4.2 1.4 0.2 I_setosa
4.9 3.1 1.5 0.1 I_setosa
5 3.2 1.2 0.2 I_setosa
5.5 3.5 1.3 0.2 I_setosa
4.9 3.1 1.5 0.1 I_setosa
4.4 3 1.3 0.2 I_setosa
5.1 3.4 1.5 0.2 I_setosa
5 3.5 1.3 0.3 I_setosa
4.5 2.3 1.3 0.3 I_setosa
4.4 3.2 1.3 0.2 I_setosa
5 3.5 1.6 0.6 I_setosa
5.1 3.8 1.9 0.4 I_setosa
4.8 3 1.4 0.3 I_setosa
5.1 3.8 1.6 0.2 I_setosa
4.6 3.2 1.4 0.2 I_setosa
5.3 3.7 1.5 0.2 I_setosa
5 3.3 1.4 0.2 I_setosa
7 3.2 4.7 1.4 I_versic
6.4 3.2 4.5 1.5 I_versic
6.9 3.1 4.9 1.5 I_versic
5.5 2.3 4 1.3 I_versic
6.5 2.8 4.6 1.5 I_versic
5.7 2.8 4.5 1.3 I_versic
6.3 3.3 4.7 1.6 I_versic
4.9 2.4 3.3 1 I_versic
6.6 2.9 4.6 1.3 I_versic
5.2 2.7 3.9 1.4 I_versic
5 2 3.5 1 I_versic
5.9 3 4.2 1.5 I_versic
6 2.2 4 1 I_versic
6.1 2.9 4.7 1.4 I_versic
5.6 2.9 3.6 1.3 I_versic
6.7 3.1 4.4 1.4 I_versic
5.6 3 4.5 1.5 I_versic
5.8 2.7 4.1 1 I_versic
6.2 2.2 4.5 1.5 I_versic
5.6 2.5 3.9 1.1 I_versic
5.9 3.2 4.8 1.8 I_versic
6.1 2.8 4 1.3 I_versic
6.3 2.5 4.9 1.5 I_versic
6.1 2.8 4.7 1.2 I_versic
6.4 2.9 4.3 1.3 I_versic
6.6 3 4.4 1.4 I_versic
6.8 2.8 4.8 1.4 I_versic
6.7 3 5 1.7 I_versic
6 2.9 4.5 1.5 I_versic
5.7 2.6 3.5 1 I_versic
5.5 2.4 3.8 1.1 I_versic
5.5 2.4 3.7 1 I_versic
5.8 2.7 3.9 1.2 I_versic
6 2.7 5.1 1.6 I_versic
5.4 3 4.5 1.5 I_versic
6 3.4 4.5 1.6 I_versic
6.7 3.1 4.7 1.5 I_versic
6.3 2.3 4.4 1.3 I_versic
5.6 3 4.1 1.3 I_versic
5.5 2.5 4 1.3 I_versic
5.5 2.6 4.4 1.2 I_versic
6.1 3 4.6 1.4 I_versic
5.8 2.6 4 1.2 I_versic
5 2.3 3.3 1 I_versic
5.6 2.7 4.2 1.3 I_versic
5.7 3 4.2 1.2 I_versic
5.7 2.9 4.2 1.3 I_versic
6.2 2.9 4.3 1.3 I_versic
5.1 2.5 3 1.1 I_versic
5.7 2.8 4.1 1.3 I_versic
6.3 3.3 6 2.5 I_virgin
5.8 2.7 5.1 1.9 I_virgin
7.1 3 5.9 2.1 I_virgin
6.3 2.9 5.6 1.8 I_virgin
6.5 3 5.8 2.2 I_virgin
7.6 3 6.6 2.1 I_virgin
4.9 2.5 4.5 1.7 I_virgin
7.3 2.9 6.3 1.8 I_virgin
6.7 2.5 5.8 1.8 I_virgin
7.2 3.6 6.1 2.5 I_virgin
6.5 3.2 5.1 2 I_virgin
6.4 2.7 5.3 1.9 I_virgin
6.8 3 5.5 2.1 I_virgin
5.7 2.5 5 2 I_virgin
5.8 2.8 5.1 2.4 I_virgin
6.4 3.2 5.3 2.3 I_virgin
6.5 3 5.5 1.8 I_virgin
7.7 3.8 6.7 2.2 I_virgin
7.7 2.6 6.9 2.3 I_virgin
6 2.2 5 1.5 I_virgin
6.9 3.2 5.7 2.3 I_virgin
5.6 2.8 4.9 2 I_virgin
7.7 2.8 6.7 2 I_virgin
6.3 2.7 4.9 1.8 I_virgin
6.7 3.3 5.7 2.1 I_virgin
7.2 3.2 6 1.8 I_virgin
6.2 2.8 4.8 1.8 I_virgin
6.1 3 4.9 1.8 I_virgin
6.4 2.8 5.6 2.1 I_virgin
7.2 3 5.8 1.6 I_virgin
7.4 2.8 6.1 1.9 I_virgin
7.9 3.8 6.4 2 I_virgin
6.4 2.8 5.6 2.2 I_virgin
6.3 2.8 5.1 1.5 I_virgin
6.1 2.6 5.6 1.4 I_virgin
7.7 3 6.1 2.3 I_virgin
6.3 3.4 5.6 2.4 I_virgin
6.4 3.1 5.5 1.8 I_virgin
6 3 4.8 1.8 I_virgin
6.9 3.1 5.4 2.1 I_virgin
6.7 3.1 5.6 2.4 I_virgin
6.9 3.1 5.1 2.3 I_virgin
5.8 2.7 5.1 1.9 I_virgin
6.8 3.2 5.9 2.3 I_virgin
6.7 3.3 5.7 2.5 I_virgin
6.7 3 5.2 2.3 I_virgin
6.3 2.5 5 1.9 I_virgin
6.5 3 5.2 2 I_virgin
6.2 3.4 5.4 2.3 I_virgin
5.9 3 5.1 1.8 I_virgin
;
proc discrim data=iris method=normal pool=yes
crossvalidate;
class Especie;
priors prop;
var Cum_Sep Lar_Sep Cum_Pet Lar_Pet ;
run;
MANOVA
MANOVA
data imc_dat;
input cat $ imc corr kcal;
cards;
AT 20.2 60.7 3200
AT 21.3 54.8 3100
AT 19.3 49.6 2800
AT 21.1 52.3 3300
SEM 22.4 14.9 2600
SEM 21.9 17.8 2700
SEM 23.8 18.6 3200
SEM 24.1 15.1 3300
SE 27.3 2.5 2700
SE 23.4 4.3 2300
SE 25.2 2.3 2600
SE 26.4 2.6 3200
PR 26.2 4.1 2600
PR 24.2 2.1 2700
PR 25.4 1.9 2650
;
proc print;
run;
proc glm;
class cat;
model imc corr kcal = cat;
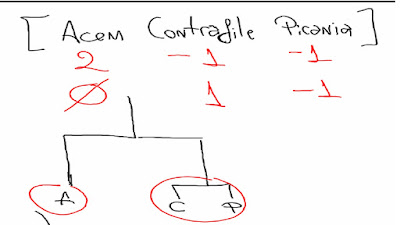
contrast " Atl e Semiat Vs Seden e Prof" cat 1 -1 -1 1;
contrast " Professor Vs Sedentario" cat 0 1 -1 0;
manova h=_all_ / printe printh;
contrast " Atl e Semiat Vs Seden e Prof" cat 1 -1 -1 1;
contrast " Professor Vs Sedentario" cat 0 1 -1 0;
run;
Correlação Residual MANOVA:
Outro Exemplo de Contrastes, Ordem Alfabética:

- Análise Multivariada Exemplos:
var imc corr kcal; ==> Kruskal Wallis
Arquivo Word para Download:
data imc_dat;
input cat $ imc corr kcal;
cards;
AT 20.2 60.7 3200
AT 21.3 54.8 3100
AT 19.3 49.6 2800
AT 21.1 52.3 3300
SEM 22.4 14.9 2600
SEM 21.9 17.8 2700
SEM 23.8 18.6 3200
SEM 24.1 15.1 3300
SE 27.3 2.5 2700
SE 23.4 4.3 2300
SE 25.2 2.3 2600
SE 26.4 2.6 3200
PR 26.2 4.1 2600
PR 24.2 2.1 2700
PR 25.4 1.9 2650
;
proc print;
run;
proc glm;
class cat;
model imc corr kcal = cat;
contrast " Atl e Semiat Vs Seden e Prof" cat 1 -1 -1 1;
contrast " Professor Vs Sedentario" cat 0 1 -1 0;
manova h=_all_ / printe printh;
contrast " Atl e Semiat Vs Seden e Prof" cat 1 -1 -1 1;
contrast " Professor Vs Sedentario" cat 0 1 -1 0;
run;
/*
contrast " Atl e Semiat Vs Seden e Prof" cat 1 -1 -1 1;
Pega a ordem alfabetica dos niveis dos fatores para os coeficientes
dos contrastes
Se colocar o contraste depois do comando MANOVA faz os contrastes univariados
tambem
contrast " Atl e Semiat Vs Seden e Prof" cat 1 -1 -1 1;
Pega a ordem alfabetica dos niveis dos fatores para os coeficientes
dos contrastes
Se colocar o contraste depois do comando MANOVA faz os contrastes univariados
tambem
*/
Correlação Residual MANOVA:
Partial Correlation Coefficients from the Error SSCP Matrix / Prob > |r|
| |||
DF = 11
|
imc
|
corr
|
kcal
|
imc
|
1.000000
|
0.017729
0.9564
|
0.697770
0.0116
|
corr
|
0.017729
0.9564
|
1.000000
|
0.132496
0.6814
|
kcal
|
0.697770
0.0116
|
0.132496
0.6814
| |
Outro Exemplo de Contrastes, Ordem Alfabética:

- Análise Multivariada Exemplos:
 |
Comparar resultados ANOVA com Kruskal-Wallis.
data imc_dat;
input cat $ imc corr kcal;
cards;
AT 20.2 60.7 3200
AT 21.3 54.8 3100
AT 19.3 49.6 2800
AT 21.1 52.3 3300
SEM 22.4 14.9 2600
SEM 21.9 17.8 2700
SEM 23.8 18.6 3200
SEM 24.1 15.1 3300
SE 27.3 2.5 2700
SE 23.4 4.3 2300
SE 25.2 2.3 2600
SE 26.4 2.6 3200
PR 26.2 4.1 2600
PR 24.2 2.1 2700
PR 25.4 1.9 2650
;
proc print;
run;
proc npar1way data=imc_dat wilcoxon dscf;
class cat;
var imc corr kcal = cat;
run;
var imc corr kcal = cat; ==> ANOVA, GLM, MANOVA
Tem um erro nesse programa, onde esta? Compare com os slides apresentados antes do programa SAS (Dois slides de Kruskal Wallis com trechos de programa SAS).
var imc corr kcal; ==> Kruskal Wallis
Resultados de Kruskal Wallis
Resultados ANOVA dados brutos, transformados e da Estat. Robusta. Tese doutorado do Gabriel.
quinta-feira, 19 de setembro de 2019
Programa em SAS para Aplicar ANOVA e Teste de Comparações Múltiplas de Tukey
Programa em SAS para Aplicar ANOVA e Teste de Comparações Múltiplas de Tukey
data imc_dat;
input cat $ imc corr kcal;
cards;
AT 20.2 60.7 3200
AT 21.3 54.8 3100
AT 19.3 49.6 2800
AT 21.1 52.3 3300
SEM 22.4 14.9 2600
SEM 21.9 17.8 2700
SEM 23.8 18.6 3200
SEM 24.1 15.1 3300
SE 27.3 2.5 2700
SE 23.4 4.3 2300
SE 25.2 2.3 2600
SE 26.4 2.6 3200
PR 26.2 4.1 2600
PR 24.2 2.1 2700
PR 25.4 1.9 2650
;
proc print;
run;
proc anova;
class cat;
model imc corr kcal = cat;
means cat / tukey lines;
run;
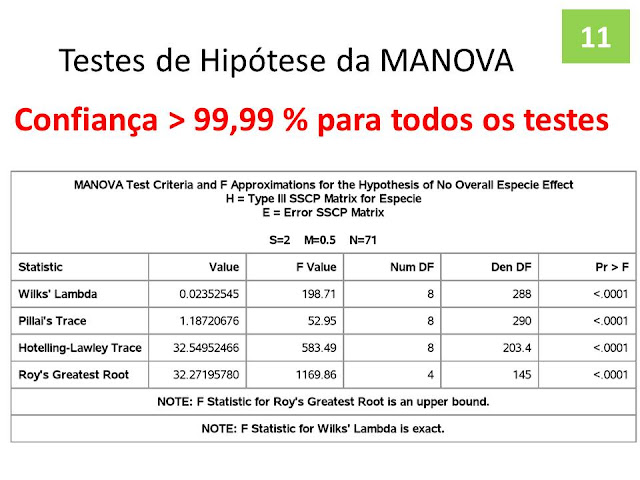
Resultado do Programa de MANOVA:
Arquivo para Download (mht abrir no Wodr)
Arquivo Word de Resultados
run;
Resultado do Programa de MANOVA:
Arquivo para Download (mht abrir no Wodr)
Arquivo Word de Resultados
Obs
|
cat
|
imc
|
corr
|
kcal
|
1
|
AT
|
20.2
|
60.7
|
3200
|
2
|
AT
|
21.3
|
54.8
|
3100
|
3
|
AT
|
19.3
|
49.6
|
2800
|
4
|
AT
|
21.1
|
52.3
|
3300
|
5
|
SEM
|
22.4
|
14.9
|
2600
|
6
|
SEM
|
21.9
|
17.8
|
2700
|
7
|
SEM
|
23.8
|
18.6
|
3200
|
8
|
SEM
|
24.1
|
15.1
|
3300
|
9
|
SE
|
27.3
|
2.5
|
2700
|
10
|
SE
|
23.4
|
4.3
|
2300
|
11
|
SE
|
25.2
|
2.3
|
2600
|
12
|
SE
|
26.4
|
2.6
|
3200
|
13
|
PR
|
26.2
|
4.1
|
2600
|
14
|
PR
|
24.2
|
2.1
|
2700
|
15
|
PR
|
25.4
|
1.9
|
2650
|
The ANOVA Procedure
Class Level Information
| ||
Class
|
Levels
|
Values
|
cat
|
4
|
AT PR SE SEM
|
Number of Observations Read
|
15
|
Number of Observations Used
|
15
|
The ANOVA Procedure
Dependent Variable: imc
Source
|
DF
|
Sum of Squares
|
Mean Square
|
F Value
|
Pr > F
|
Model
|
3
|
63.99233333
|
21.33077778
|
14.23
|
0.0004
|
Error
|
11
|
16.49166667
|
1.49924242
| ||
Corrected Total
|
14
|
80.48400000
|
R-Square
|
Coeff Var
|
Root MSE
|
imc Mean
|
0.795094
|
5.214802
|
1.224436
|
23.48000
|
Source
|
DF
|
Anova SS
|
Mean Square
|
F Value
|
Pr > F
|
cat
|
3
|
63.99233333
|
21.33077778
|
14.23
|
0.0004
|
Gráfico Chamado: Box and Wisker Plot
The ANOVA Procedure
Dependent Variable: corr
Source
|
DF
|
Sum of Squares
|
Mean Square
|
F Value
|
Pr > F
|
Model
|
3
|
6829.158500
|
2276.386167
|
300.25
|
<.0001
|
Error
|
11
|
83.397500
|
7.581591
| ||
Corrected Total
|
14
|
6912.556000
|
R-Square
|
Coeff Var
|
Root MSE
|
corr Mean
|
0.987935
|
13.60410
|
2.753469
|
20.24000
|
Source
|
DF
|
Anova SS
|
Mean Square
|
F Value
|
Pr > F
|
cat
|
3
|
6829.158500
|
2276.386167
|
300.25
|
<.0001
|
The ANOVA Procedure
Dependent Variable: kcal
Source
|
DF
|
Sum of Squares
|
Mean Square
|
F Value
|
Pr > F
|
Model
|
3
|
497333.333
|
165777.778
|
1.95
|
0.1801
|
Error
|
11
|
935000.000
|
85000.000
| ||
Corrected Total
|
14
|
1432333.333
|
R-Square
|
Coeff Var
|
Root MSE
|
kcal Mean
|
0.347219
|
10.18210
|
291.5476
|
2863.333
|
Source
|
DF
|
Anova SS
|
Mean Square
|
F Value
|
Pr > F
|
cat
|
3
|
497333.3333
|
165777.7778
|
1.95
|
0.1801
|
Sabemos que existem diferenças entre as categorias para Índice de Massa Corporal e para Quilômetros caminhados ou corridos por semana. Para as Quilocalorias não achamos diferenças entre as categorias.
The ANOVA Procedure
The ANOVA Procedure
Tukey's Studentized Range (HSD) Test for imc
Note:
|
This test controls the Type I experimentwise error rate, but it generally has a higher Type II error rate than REGWQ.
|
Alpha
|
0.05 = 5%
|
Error Degrees of Freedom
|
11
|
Error Mean Square
|
1.499242
|
Critical Value of Studentized Range
|
4.25603
|
Minimum Significant Difference
|
2.712
|
Harmonic Mean of Cell Sizes
|
3.692308
|
Note:
|
Cell sizes are not equal.
|
Means with the same letter
are not significantly different. | ||||
Tukey Grouping
|
Mean
|
N
|
cat
| |
A
|
25.5750
|
4
|
SE
| |
A
| ||||
A
|
25.2667
|
3
|
PR
| |
A
| ||||
B
|
A
|
23.0500
|
4
|
SEM
|
B
| ||||
B
|
20.4750
|
4
|
AT
| |
The ANOVA Procedure
The ANOVA Procedure
Tukey's Studentized Range (HSD) Test for corr
Note:
|
This test controls the Type I experimentwise error rate, but it generally has a higher Type II error rate than REGWQ.
|
Alpha
|
0.05
|
Error Degrees of Freedom
|
11
|
Error Mean Square
|
7.581591
|
Critical Value of Studentized Range
|
4.25603
|
Minimum Significant Difference
|
6.0987
|
Harmonic Mean of Cell Sizes
|
3.692308
|
Note:
|
Cell sizes are not equal.
|
Means with the same letter
are not significantly different. | |||
Tukey Grouping
|
Mean
|
N
|
cat
|
A
|
54.350
|
4
|
AT
|
B
|
16.600
|
4
|
SEM
|
C
|
2.925
|
4
|
SE
|
C
| |||
C
|
2.700
|
3
|
PR
|
The ANOVA Procedure
The ANOVA Procedure
Tukey's Studentized Range (HSD) Test for kcal
Note:
|
This test controls the Type I experimentwise error rate, but it generally has a higher Type II error rate than REGWQ.
|
Alpha
|
0.05
|
Error Degrees of Freedom
|
11
|
Error Mean Square
|
85000
|
Critical Value of Studentized Range
|
4.25603
|
Minimum Significant Difference
|
645.75
|
Harmonic Mean of Cell Sizes
|
3.692308
|
Note:
|
Cell sizes are not equal.
|
Means with the same letter
are not significantly different. | |||
Tukey Grouping
|
Mean
|
N
|
cat
|
A
|
3100.0
|
4
|
AT
|
A
| |||
A
|
2950.0
|
4
|
SEM
|
A
| |||
A
|
2700.0
|
4
|
SE
|
A
| |||
A
|
2650.0
|
3
|
PR
|
Assinar:
Comentários (Atom)


